Graphs in Financial Markets
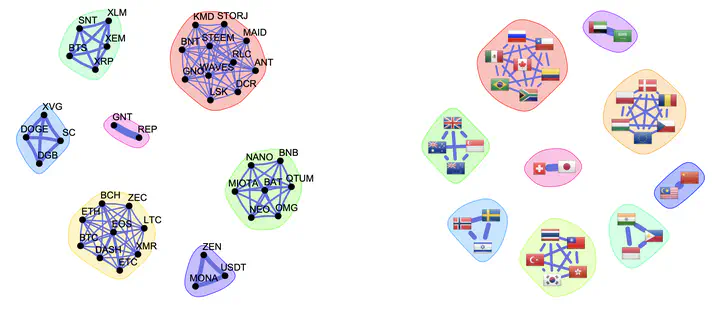 Graphs of cryptos and fiat currencies
Financial markets generate high-dimensional, non-Gaussian, and time-varying data that challenge classical statistical models. Graph-based representations offer a principled way to capture the dependency structure among assets — stocks, cryptocurrencies, FX rates — and to reveal market sectors, risk propagation channels, and crisis dynamics that are invisible to traditional analysis.
Our research develops methods for learning financial graphs in three interconnected settings: static structured graph learning, which jointly estimates the precision matrix and graph topology by exploiting graph stationarity and spectral Laplacian constraints, yielding robust sparse, k-component, and bipartite graphs that reflect market sector structure; heavy-tailed graphical models, where Student-t likelihoods replace Gaussian assumptions to handle fat-tailed financial returns; and time-varying graph learning, which combines temporal priors with heavy-tailed likelihoods to track market dynamics, detect crises, and improve portfolio performance. Throughout, connections to graph signal processing — shift operators, graph filters, and stationarity — provide both theoretical grounding and computational tools.
Software
Book
- Daniel P. Palomar, Portfolio Optimization: Theory and Application, Cambridge University Press, 2025.
Book chapters
-
José Vinícius de M. Cardoso, Jiaxi Ying, and Daniel P. Palomar, “Learning Graphs from Heavy-Tailed Data,” in Elliptically Symmetric Distributions in Signal Processing and Machine Learning, Eds. J.-P. Delmas, M. N. El Korso, S. Fortunati, F. Pascal, Springer, Jul. 2024.
-
José Vinícius de M. Cardoso, Jiaxi Ying, and Daniel P. Palomar, “Nonconvex Graph Learning: Sparsity, Heavy-tails, and Clustering,” in Signal Processing and Machine Learning Theory, Digital Signal Processing Series, Elsevier, Dec. 2022. 📕
Papers
-
Amirhossein Javaheri, Jiaxi Ying, Daniel P. Palomar, and Farokh Marvasti, “Time-Varying Graph Learning for Data with Heavy-Tailed Distribution,” IEEE Trans. on Signal Processing, vol. 73, pp. 3044-3060, 2025.
-
Andrei Buciulea, Jiaxi Ying, Antonio G. Marques, and Daniel P. Palomar, “Polynomial Graphical Lasso: Learning Edges from Gaussian Graph-Stationary Signals,” IEEE Trans. on Signal Processing, vol. 73, pp. 1153-1167, 2025.
-
Amirhossein Javaheri, Arash Amini, Farokh Marvasti, and Daniel P. Palomar, “Learning Spatio-Temporal Graphical Models From Incomplete Observations,” IEEE Trans. on Signal Processing, vol. 72, pp. 1361-1374, 2024.
-
Jian-Feng Cai, José Vinícius de M. Cardoso, Daniel P. Palomar, and Jiaxi Ying, “Fast Projected Newton-like Method for Precision Matrix Estimation under Total Positivity,” Advances in Neural Information Processing Systems (NeurIPS), New Orleans, LA, USA, Dec. 2023. [26.1% acceptance rate] [video] [slides] [poster]
-
Xiwen Wang, Jiaxi Ying, and Daniel P. Palomar, “Learning Large-Scale MTP2 Gaussian Graphical Models via Bridge-Block Decomposition,” Advances in Neural Information Processing Systems (NeurIPS), New Orleans, LA, USA, Dec. 2023. [26.1% acceptance rate] [video] [slides] [poster]
-
Jiaxi Ying, José Vinícius de M. Cardoso, and Daniel P. Palomar, “Adaptive Estimation of Graphical Models under Total Positivity,” in Proc. of the International Conference on Machine Learning (ICML), Honolulu, HI, USA, July 2023. [27.9% acceptance rate]
-
José Vinícius de M. Cardoso, Jiaxi Ying, and Daniel P. Palomar, “Learning Bipartite Graphs: Heavy Tails and Multiple Components,” Advances in Neural Information Processing Systems (NeurIPS), New Orleans, LA, USA, Dec. 2022. [25.6% acceptance rate] [video] [slides] [poster] [R package bipartite]
-
Rui Zhou, Jiaxi Ying, and Daniel P. Palomar, “Covariance Matrix Estimation Under Low-Rank Factor Model with Nonnegative Correlations,” IEEE Trans. on Signal Processing, vol. 70, pp. 4020-4030, Aug. 2022.
-
José Vinícius de M. Cardoso, Jiaxi Ying, and Daniel P. Palomar, “Graphical Models for Heavy-Tailed Markets,” Advances in Neural Information Processing Systems (NeurIPS), Virtual, Dec. 2021. [26% acceptance rate] [video] [supplemental material] [slides] [poster] [R package fingraph]
-
Jiaxi Ying, José Vinícius de M. Cardoso, and Daniel P. Palomar, “Minimax Estimation of Laplacian Constrained Precision Matrices,” in Proc. of the 24th International Conference on Artificial Intelligence and Statistics (AISTATS), vol. 130, pp. 3736-3744, April 2021. [29.8% acceptance rate] [R package]
-
Jiaxi Ying, José Vinícius de M. Cardoso, and Daniel P. Palomar, “Nonconvex Sparse Graph Learning under Laplacian Constrained Graphical Model,” Advances in Neural Information Processing Systems (NeurIPS), Dec. 2020. [2-min video] [slides] [poster [R package]
-
Sandeep Kumar, Jiaxi Ying, José Vinícius de M. Cardoso, and Daniel P. Palomar, “A Unified Framework For Structured Graph Learning Via Spectral Constraints,” Journal of Machine Learning Research (JMLR), 21(22): 1-60, Jan. 2020.
-
Sandeep Kumar, Jiaxi Ying, José Vinícius de M. Cardoso, and Daniel P. Palomar, “Structured Graph Learning Via Laplacian Spectral Constraints,” Advances in Neural Information Processing Systems (NeurIPS), Dec. 2019. [2-min video] [slides] [poster] [arXiv] [R package]
-
Licheng Zhao, Yiwei Wang, Sandeep Kumar, and Daniel P. Palomar, “Optimization Algorithms for Graph Laplacian Estimation via ADMM and MM,” IEEE Trans. on Signal Processing, vol. 67, no. 16, pp. 4231-4244, Aug. 2019. [R package spectralGraphTopology]